 By Tom Shapland, PhD, July 14, 2020
We’re excited to announce our latest feature, FieldStat Adjustments! If FieldStat seems too high or too low, you can now adjust FieldStat to a higher or lower value.
Some management practices can sometimes cause errors in Tule’s measurement of the max canopy size (i.e., the Crop Coefficient). An incorrect max canopy size makes FieldStat too high or too low. With the FieldStat Adjustments feature, you set the max canopy value, which shifts FieldStat up or down. This new feature creates an environment for you to collaborate with our team to make sure your max canopy size and FieldStat readings are accurate.
Background
FieldStat
First, let's review FieldStat. In the academic literature, FieldStat is known as the Water Stress Coefficient (Ks) in the United Nations Food and Agriculture Organization’s Crop Evapotranspiration paradigm (FAO ET). This paradigm says the amount of water a plant uses (Actual ET) is influenced by the weather (Reference ET), the canopy size (Crop Coefficient, i.e., Kc), and the degree of water stress (Water Stress Coefficient, i.e., Ks or FieldStat).
Actual ET = Reference ET * Crop Coefficient * Water Stress Coefficient
What does the FAO ET paradigm tell us if we isolate the Water Stress Coefficient, like this?
Water Stress Coefficient = Actual ET / (Reference ET * Crop Coefficient)
The numerator, Actual ET, tells us the amount of water your plants are using. The denominator, Reference ET times the Crop Coefficient, tells us how much water your plants could be using, given the weather and the size of the plant canopy. Therefore, the above relationship says, “If your plants are using less water than they could be using, then they are water stressed.” In other words, if the water use of your plants is less than the potential water use of your plants, then the plants are responding to the inadequate soil water supply and reducing their water use accordingly.
Tule calculates the Water Stress Coefficient to provide you with the water stress level of the plants in your field. We call it FieldStat, because Water Stress Coefficient or Ks sounded too academic. We measure the Actual ET with our in-field sensor. We determine the block-specific Reference ET using remote sensing methods. We measure the Crop Coefficient with the sensor and remote sensing (more on that later). We plug Actual ET, Reference ET, and the Crop Coefficient into the above equation, and the result is FieldStat.
When FieldStat is equal to one, then the plants are not water stressed and they are using all the water they could be using. When FieldStat is less than one, then the plants are water stressed and they are using less water than they could be using.
Crop Coefficient Measurements
Have you ever wondered where the Crop Coefficient values in your irrigation spreadsheets came from? Researchers measured the Crop Coefficient for a crop type (i.e., almonds) in a particular field, or in a few different fields of the same crop type, using lysimetry, eddy covariance, or surface renewal (Tule’s method for measuring Actual ET). The researchers started with the FAO ET paradigm.
Actual ET = Reference ET * Crop Coefficient * Water Stress Coefficient
They rearranged the terms to get this:
Crop Coefficient = Actual ET / (Reference ET * Water Stress Coefficient)
If you’re trying to measure the Crop Coefficient, then that Water Stress Coefficient is inconvenient. To avoid this inconvenience, researchers would keep the plants very well irrigated, making it a safe assumption that the Water Stress Coefficient is equal to one. If the Water Stress Coefficient is equal to one, then we can ignore it.
Crop Coefficient = Actual ET / Reference ET
In effect, this says, “Assuming the plants are not experiencing any water stress, the influence of the canopy size on plant water use (i.e., the Crop Coefficient) is the plant water use compared to the water use of a well-watered lawn.” In other words, the Crop Coefficient tells you how much water your plants use compared to a grass field, if your plants are not experiencing any water stress.
We measure the Crop Coefficient in your field in a similar way. Tule’s Plant Response Index is the Actual ET divided by the Reference ET. In the beginning of the season when the canopies are growing in, we assume the plants are not experiencing water stress. When the Plant Response Index reaches its maximum weekly value, then the canopies have reached their maximum size. Our algorithm determines the Crop Coefficient for your field as the Plant Response Index's maximum weekly value.
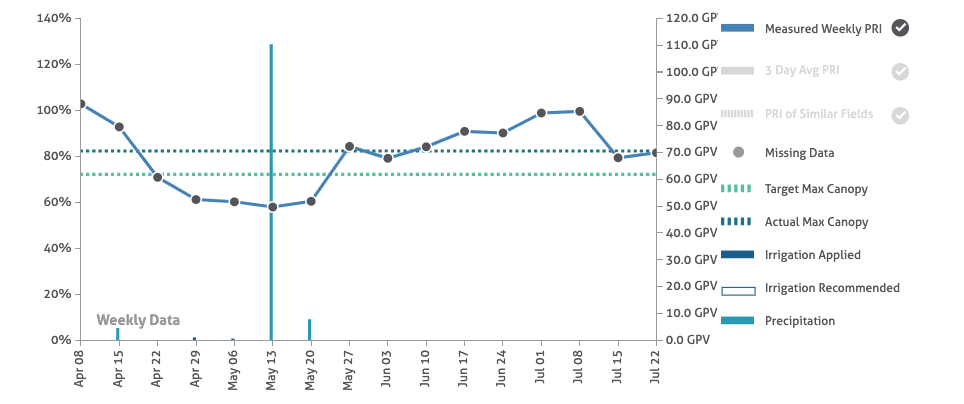
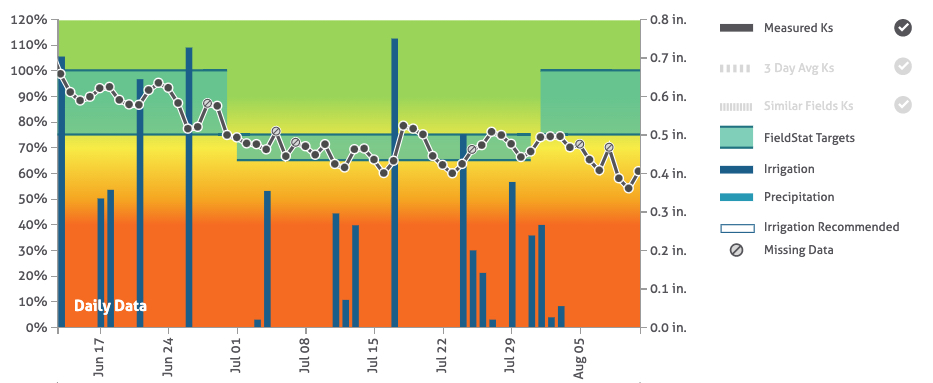
Here is an example for winegrapes. During the weeks of April 8 and April 15, the Plant Response Index is mostly influenced by the cover crop. Between April 15 and May 13, the cover crop is mowed and dries out, so the Plant Response Index decreases. From May 13 through July 8, we see the Plant Response Index increase as the vine canopy grows. On the week of July 8, we see the vine canopy has reached its maximum size. Our algorithm calculates the Crop Coefficient as the maximum weekly Plant Response Index value, which for this field is the Plant Response Index on the week of July 8. After July 8, the Plant Response Index decreases, presumably as a result of the onset of water stress (i.e., the Water Stress Coefficient decreases from one to a number less than than one).
FieldStat Bias
When FieldStat is too high or too low, the most frequent cause is our algorithm incorrectly determined the Crop Coefficient. If the Crop Coefficient (i.e., the max canopy size) is wrong, then FieldStat will also be wrong.
FieldStat = Water Stress Coefficient = Actual ET / (Reference ET * Crop Coefficient)
More specifically, if the Crop Coefficient is too large, then FieldStat will be too low, showing too much stress. If the Crop Coefficient is too small, then FieldStat will be too high, showing not enough stress.
Tule does not know about the timing of every cultural practice in your field. Our algorithm cannot take into account cultural practices that dramatically change the canopy size. Let’s consider a winegrape example. For a winegrape vineyard, a typical hedging pass in a typical year does not remove enough canopy to change the Crop Coefficient. However, in years like 2019, when three inches of rain fell in the middle of May in some viticultural regions of California, the vines grew so large, and growers lopped off so much canopy, that the hedging passes in many vineyards substantially changed the Crop Coefficient.
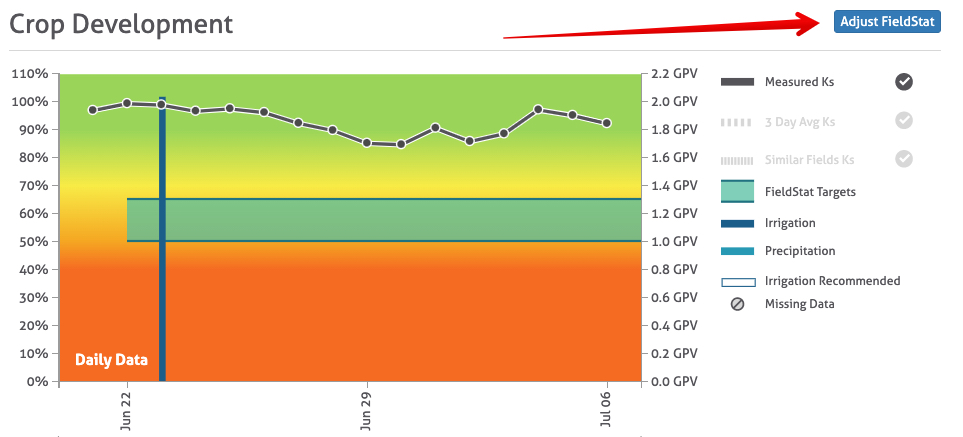
The above chart is the same Plant Response Index chart example that we examined previously. Although initially we thought the decrease in the Plant Response Index after July 8 was a result of water stress, it turns out the actual cause was a hedging pass. We see the Plant Response Index decrease because a large amount of canopy was removed from the vines during the week of July 8.
The purpose of the new FieldStat Adjustments feature is to account for the influence of significant changes to the canopy size on FieldStat. In the above example, our algorithm initially set the max canopy size (i.e., the Crop Coefficient) to July 8, the week before the hedging pass. The max canopy size was too large, so FieldStat showed too much stress. With the FieldStat Adjustments feature, you now have the ability to set the max canopy size to a different weekly Plant Response Index value, thereby adjusting FieldStat from showing too much stress to showing the right amount of stress.
Below you’ll find instructions for using the FieldStat Adjustments feature. But before we start clicking around the Tule dashboard, here are a few things to note:
- By default, Tule’s algorithm will continue to determine the max canopy value.
- Whenever you make a change to the max canopy value (i.e., Crop Coefficient) for any of your blocks, our team receives a notification and reviews the changes you made. If something looks amiss to us, then we will reach out to you. This feature allows us to collaborate with you on getting the max canopy size and FieldStat right.
- Currently, annual crop types are excluded from the FieldStat Adjustment feature.
Feature Access
The FieldStat Adjustment feature can be accessed in two places: First, on the block details page via a button above the FieldStat chart here:
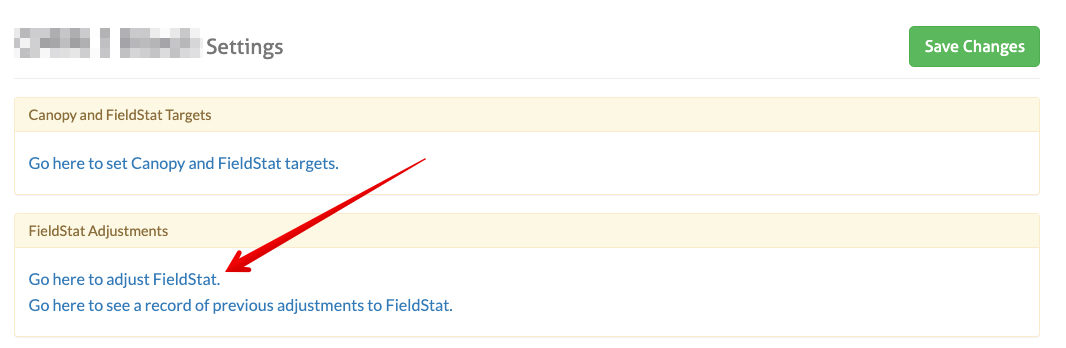
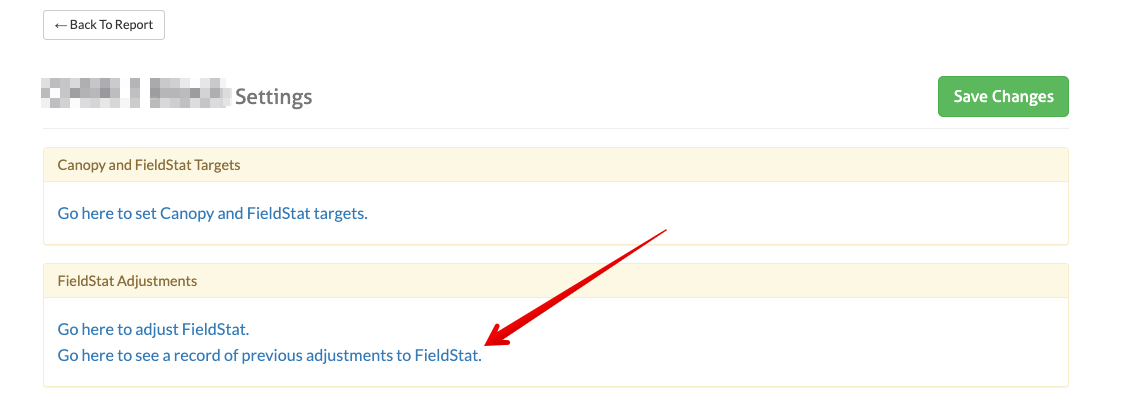
And also via a link in the block settings page:
User Workflow
There are three steps to making adjustments to FieldStat:
- Step 1. Confirm Canopy Stage
- Step 2. Evaluate FieldStat
- Step 3. Adjust Stress
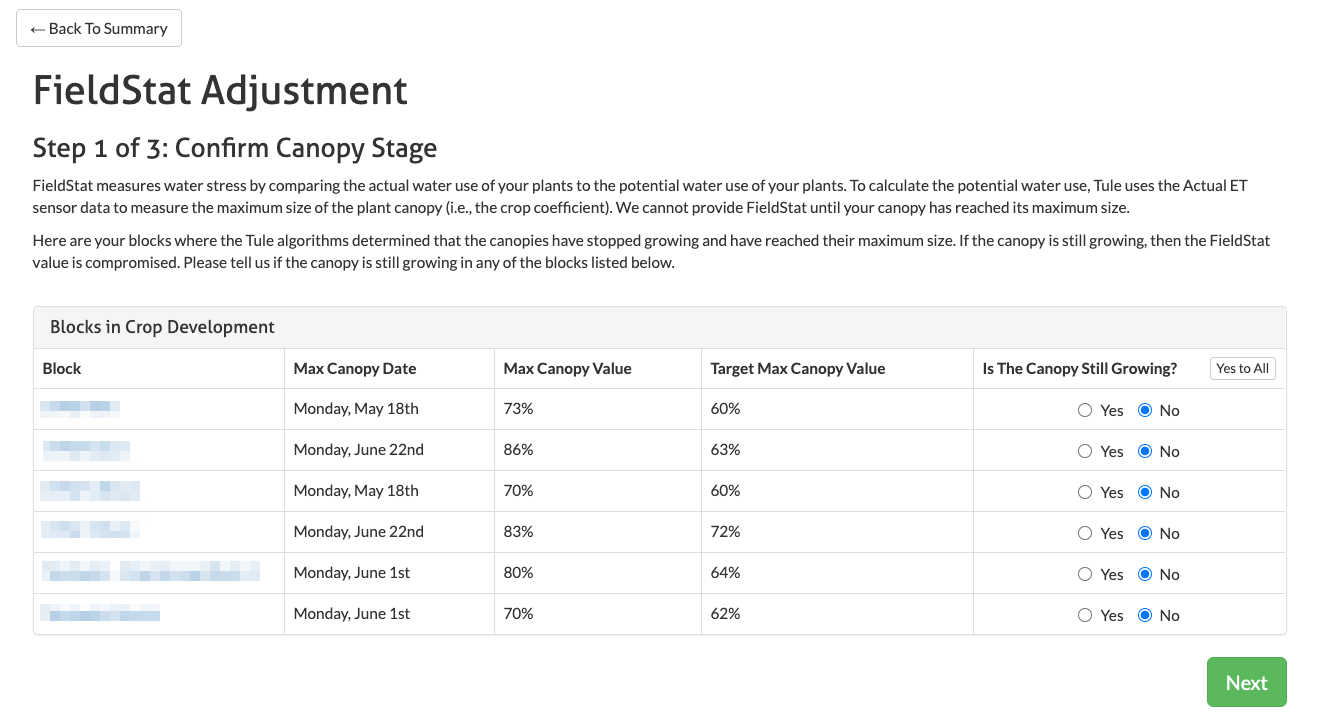
Step One: Confirm Canopy Stage
This step provides an opportunity for you to move a block from the crop development stage back into the canopy development stage. If the canopy is still growing, then the FieldStat value is compromised. If you have a block in the crop development stage (i.e., you can see FieldStat) on the Tule dashboard, but the canopy is still growing, then our algorithm has mistakenly identified the Crop Coefficient. In these cases, select ‘Yes’ for ‘Is The Canopy Still Growing’ next to the block name, then click ‘Next’, to push the block out of crop development and back into canopy development.
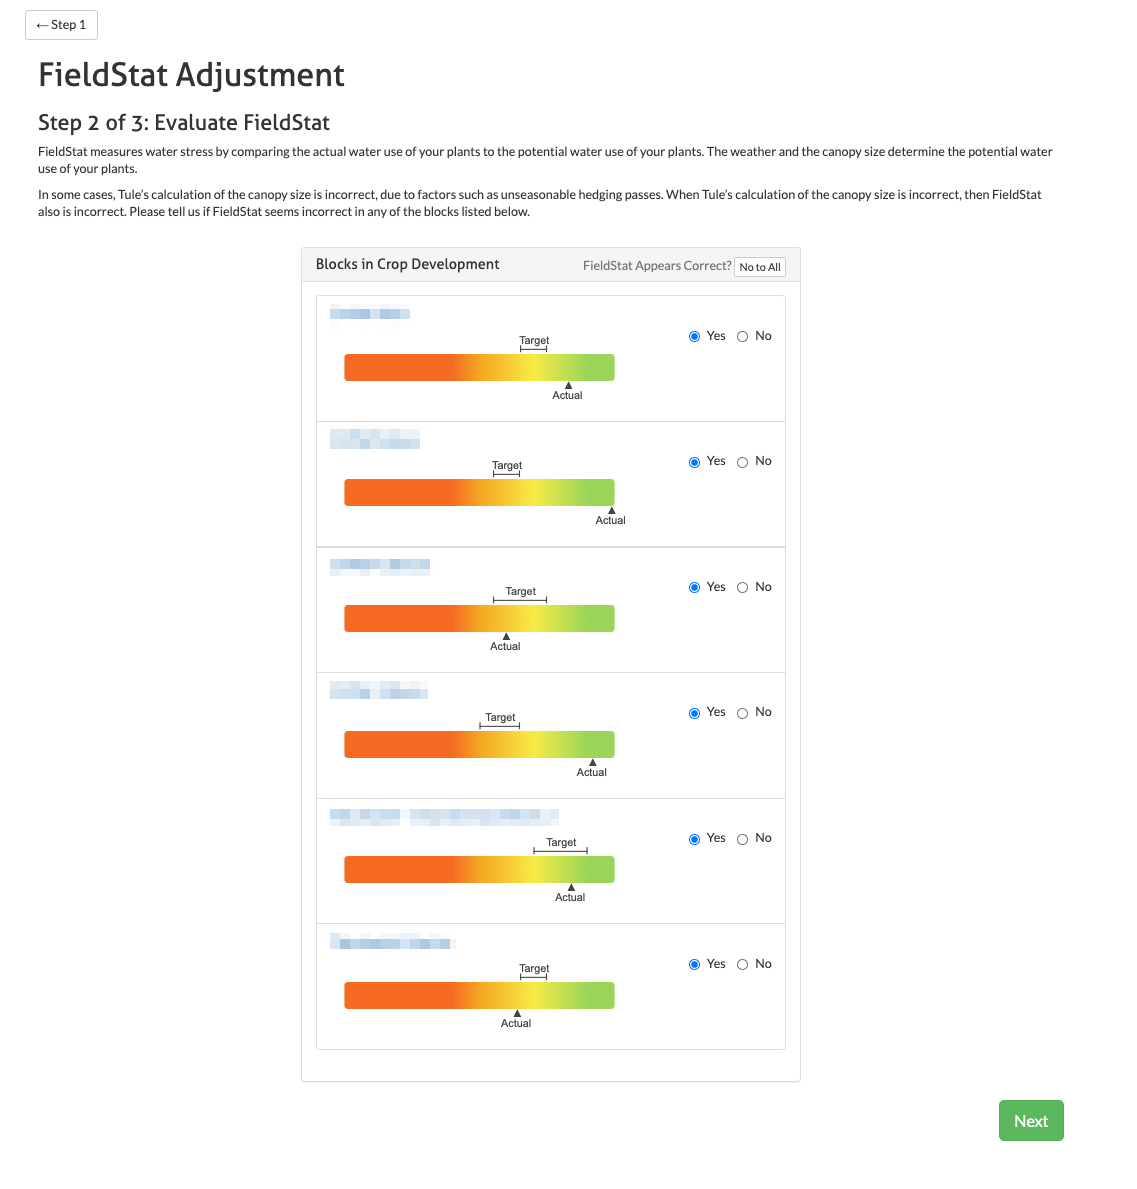
Step Two: Evaluate FieldStat
The purpose of this step is to allow you to view the FieldStat of your blocks, and select any blocks that appear incorrect. If FieldStat appears incorrect for any of your blocks, then select ‘No’ for ‘FieldStat Appears Correct’ next to the block name, then click ‘Next’.
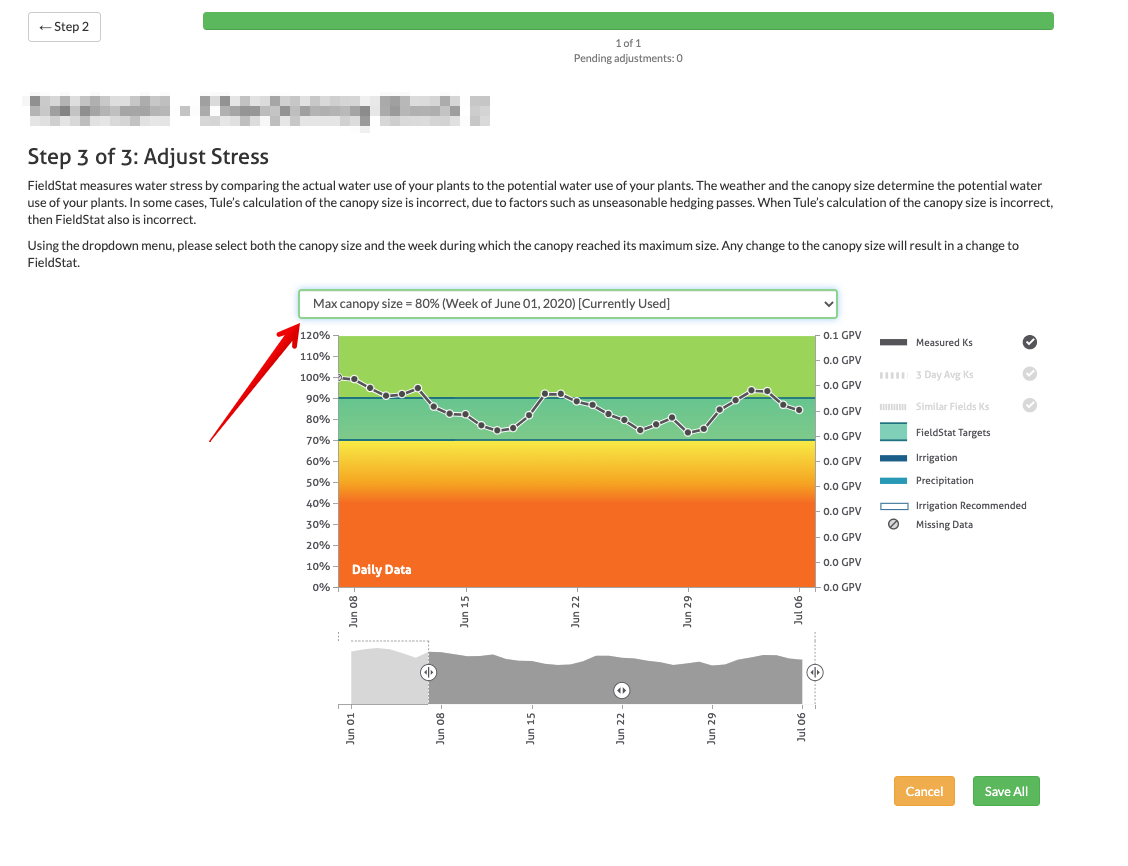
Step Three: Adjust Stress
Next, you will select a different max canopy value (i.e., Crop Coefficient) to adjust FieldStat to a higher or lower value. To adjust FieldStat, you will be prompted to select the week that the canopy reached its maximum size from the dropdown menu. Each time you select a different week, the FieldStat chart below the dropdown menu will update according to your selection. Once the appropriate selection is made and you click the “Next" button, the adjustment is temporarily recorded as "pending". After you have made adjustments to all the blocks that you would like to change, then click ‘Save All’.
Special Case: Blocks in Forecast Mode
If a block is in Forecast Mode, an additional alert window will appear, telling you that any adjustments you make will not immediately appear in the dashboard. The forecast model uses the max canopy value (i.e. Crop Coefficient) as one of a few inputs for forecasting FieldStat. When you provide a new max canopy value, we retrain the forecast model with the new max canopy value. It takes about one to two days for the model training to complete. Once the model training is complete, the dashboard will be updated with the adjusted FieldStat values.
Tuning Logs
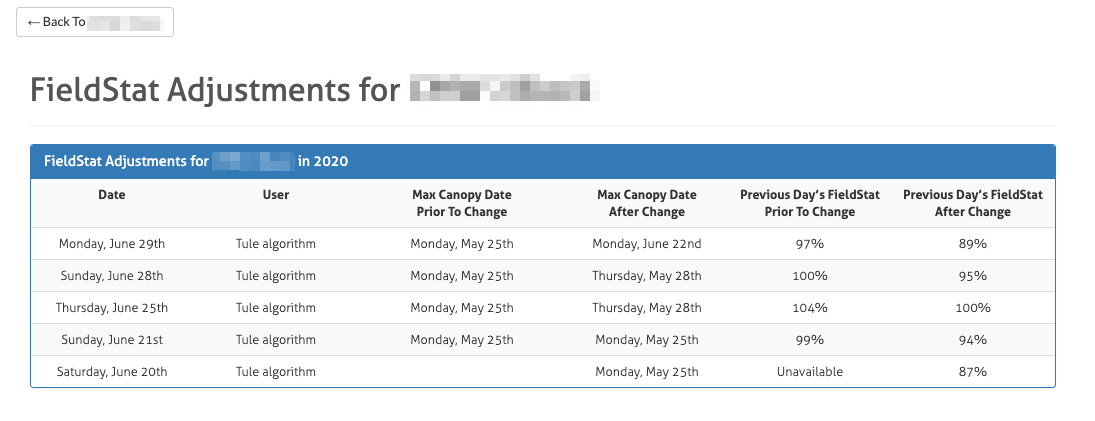
Adjustments to FieldStat are recorded as "Tuning Logs" and are accessible through the link in the block settings page.
Every time a change is made to the max canopy value, there is a record in the log of the date the change was made, who made the change, and the change in the FieldStat value.
Let us know what you think! We'd love to hear from you.

