Introduction & Background
Reference ET vs Measured ET
Growers have long used Reference Evapotranspiration (ETo), which is an estimate of the water use of a well-watered lawn, as a guide for irrigating their crops. Reference ET data from local weather stations such as the California Irrigation Management Information System (CIMIS), combined with rules of thumb for estimating canopy size (Kc) and water stress (Ks) coefficients, have helped growers approximate the water requirements of their fields. Although growers know that their crops behave differently than grass, the Reference ET method is widely used because measuring evapotranspiration on their own fields was, until recently, far too expensive to be done outside of academia.
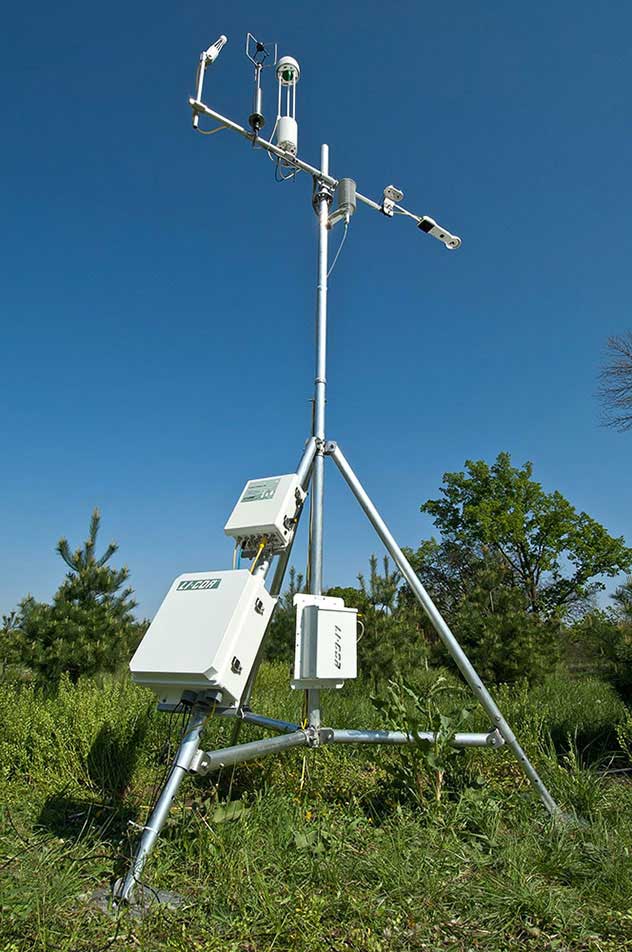
In a perfect world, growers would be able to measure the evapotranspiration of their fields directly, instead of estimating it using Reference ET and approximate rules of thumb for Kc and Ks. Measuring ET (the actual water use of an individual field) is possible, but until recently it was prohibitively expensive for anyone who didn’t have a six figure research budget. Recent advances in the measurement of evapotranspiration using the Surface Renewal method have enabled the direct measurement of evapotranspiration from crop fields at a cost that is, for the first time ever, cost-effective for growers to use at production scale.
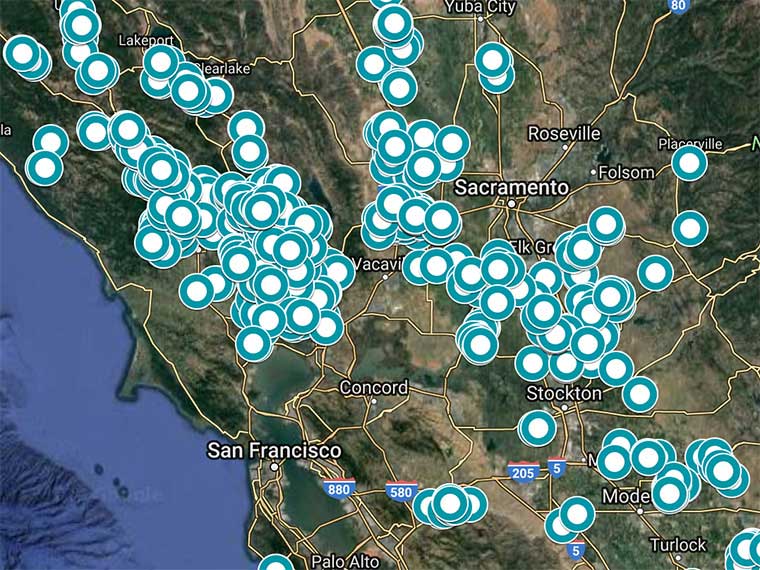
This new method of measuring ET, several orders of magnitude less expensive to deploy than prior techniques, is enabled by a key innovation in surface renewal developed by Dr. Tom Shapland during his PhD research at UC Davis. In addition to quantifying the daily water usage of a field, Tule’s measured ET data also enables the company to remotely determine the canopy size and daily crop stress for a field. Because Tule’s system continuously tracks water inputs to each field via irrigation and precipitation, a grower using Tule can, for the first time ever, see the full picture of water inputs (irrigation and precipitation), water outputs (measured ET), and plant water status (crop stress) every day. After deploying sensors for hundreds of growers across thousands of farm fields over the last five years, Tule now has the world’s largest agricultural dataset that connects daily water inputs and outputs to crop stress.
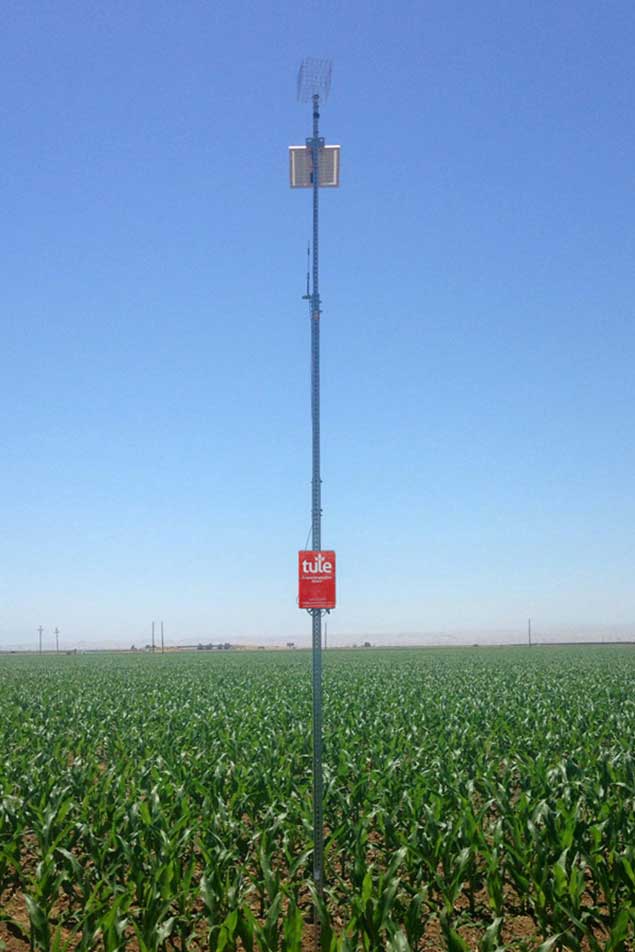
This dataset, created using automated daily measurements over multiple acres rather than a single point in the field, enables a level of consistency and accuracy that is impossible with other techniques that require growers to take a small number of point measurements by hand. Tule’s unique dataset, the only one of it’s kind in the world, is the foundation needed for unlocking the development of next-generation precision agriculture products based on machine learning and artificial intelligence.
Machine Learning and Artificial Intelligence for Agriculture
These days, it’s hard to pick-up a newspaper or listen to a show without hearing something about machine learning or artificial intelligence (machine learning can be considered a subset of the broader trend in artificial intelligence). The AI revolution is upon us, and agriculture, like many other industries, will see wide-ranging effects. Why has machine learning suddenly surfaced as such a disruptive force in agriculture (and so many other industries outside of Silicon Valley)? In short, it’s the confluence of several long term trends that are now combining to rapidly upend traditional ways of doing things:
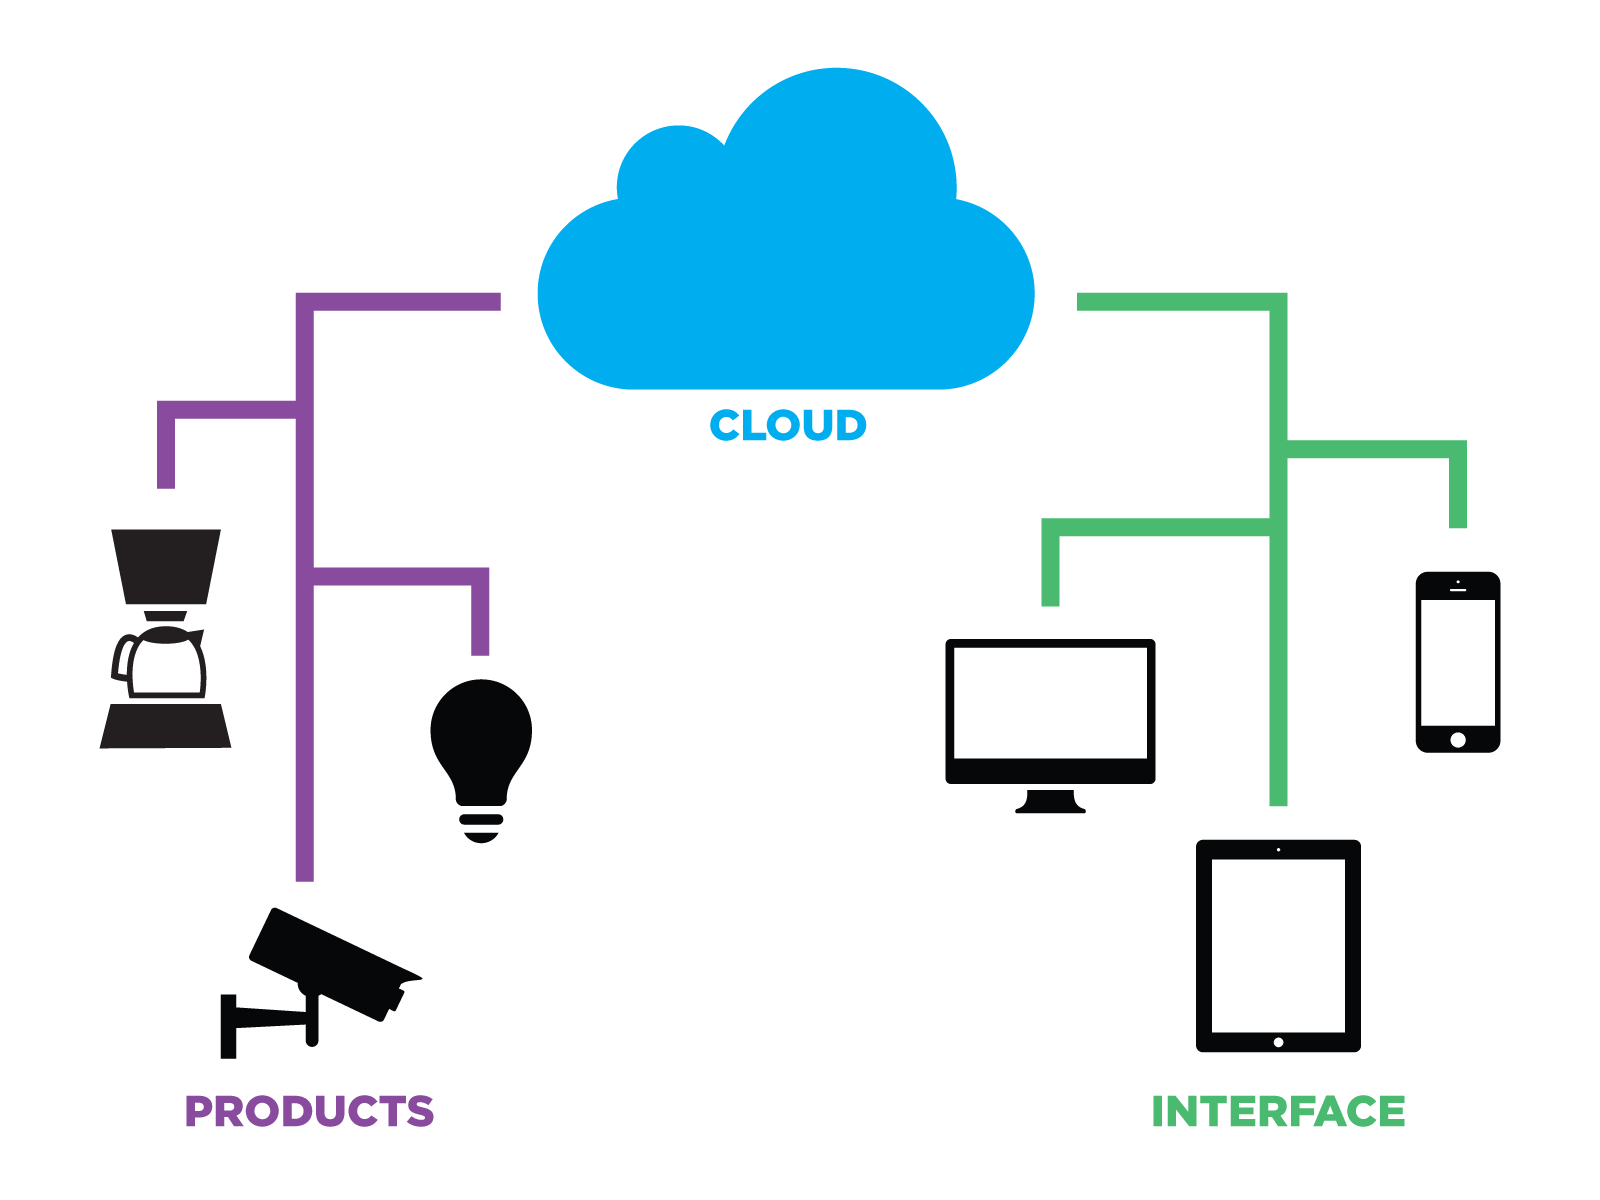
- Internet of Things - enables the collection of data about the physical world. It is now possible to measure physical systems in the real world as we previously only measured digital systems that were 100% software based.
- Cloud Computing - training artificial intelligence algorithms on huge sets of data requires massive computational resources. Fortunately, thanks to tools like Amazon Web Services (AWS) and Google Cloud, supercomputer-scale computing resources are now available to anyone with a laptop and an internet connection at ever more competitive prices.
In the context of agriculture specifically, the confluence of these trends have enabled companies with the right combination of data and technical expertise to bring artificial intelligence techniques to bear on some of the agriculture industry’s hardest problems. These companies, though varied in their areas of focus, follow a common pattern: using internet-connected sensing systems, they capture huge quantities of data about crops, and use that data to train machine learning-based systems that have superhuman abilities to understand, model, and predict what’s happening in farm fields. Tule’s Water Stress Forecast feature, released in 2017, is one concrete example of this trend in action.
Machine Learning for Better Irrigation Management
The Challenge Irrigation Managers Face
When irrigation managers talk about how they have traditionally made irrigation decisions for a particular field, their method usually involves a combination of knowledge about the type of crop planted, information about the unique attributes of the field in question (including both readily available attributes like location as well as experiential-based intuition about the field attributes that are not possible to measure efficiently like recent changes in a plant’s vascular conductivity), and recent impressions about the field collected by their scouts. Every time they make their irrigation plans, they try to take all of this information as inputs, weigh it in their minds, and make their best guess about when to irrigate and how much to apply given whatever goals their organization has for the field. They may not call it by name, but in their minds, they are building a mental model of the field that helps them understand the relationship between irrigation and crop stress of the field.
What if, instead of doing this difficult, error-prone process for every field in their heads, they could have a machine build and update this model for them? This is what Tule’s Water Stress Forecast feature provides to growers. How this feature works is a great example of using machine learning to give growers insight into their fields in ways that the agriculture industry has never seen before.
The Moisture Release Curve
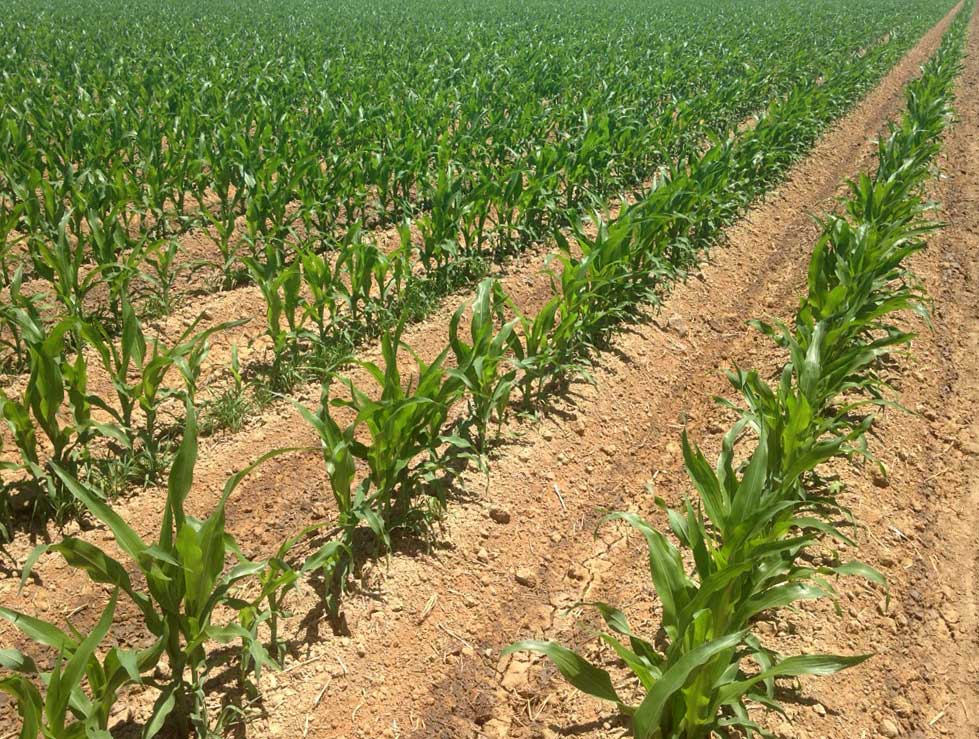
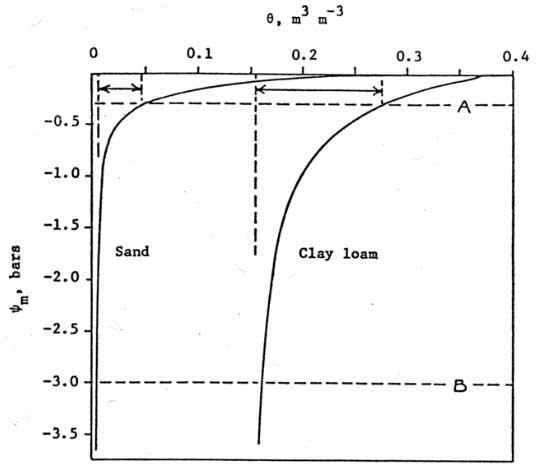
The idea of a model that shows the relationship between irrigation and plant water status (mental or machine) is actually a well-understood concept in plant science. In his classic text on plant-water relations, UC Davis Professor Emeritus Dr. Ted Hsiao calls this a “moisture release curve.” A Moisture Release Curve (MRC) demonstrates that the relationship between available water in the soil and plant water status is curvilinear. Soils with a lower water holding capacity will have a steeper curve than soils with a higher water holding capacity. This won’t be surprising to most growers, who experience the real-world effects of this when they notice that a crop grown on sandy soil responds differently than the same crop grown on a clay loam soil.
The challenging thing about this for growers is that every field is different - the combination of different crops, varietal, soils, nutrition, agronomic practices, pest pressure, weather and other factors mean that each field’s moisture release curve will be a slightly different shape, and the crop’s response to water lost or applied will also be unique. This is why even experienced irrigation managers with decades of experience often make the wrong decision when they try to predict what each field needs in terms of irrigation.
Applying Machine Learning to Moisture Release Curves
Building on the idea of a moisture release curve, the team at Tule thought it might be possible to use Tule’s unique dataset of daily measurements for water lost (measured ET), water applied (via irrigation and precipitation) and crop stress to build a process that can automatically create a site-specific model for every field that captures the relationship between available water and crop stress, inclusive of the nuances and attributes that make each field different from the next.
Creating a site-specific moisture release curve in the context of production-scale agriculture is challenging for several reasons:
- The curvilinear nature of the moisture release curve means that one must have enough data from each field to understand how the relationship between available water and crop stress changes across the range of conditions in the field. For example, at one end of the curve, adding a small amount of water may cause a substantial reduction in crop stress. On the other end of the curve, adding even relatively large amount of water may have very little impact on crop stress.
- Identifying where each field is on the curve is much easier if an initial condition is known (a starting point on the curve where both the available water and crop stress are known with confidence). In production agriculture, finding this initial condition for an field is quite difficult without prohibitively expensive research equipment.
- Every crop field is different. Even fields with the same crop grown on similar soil will have different relationships between crop stress and available water. This is occurs because soil type is only one factor that influences how water availability affects plants. Other factors (varietal, nutrition, rooting depth, agronomic practices, pest pressure, etc) will also affect the how crop stress changes with respect to available water. A moisture release curve that intends to capture the relationship between water and stress for any given field needs to integrate all of these factors.
The complexity inherent to the moisture release curve problem makes it an ideal candidate for the application of machine learning. In practice, this means that instead of having an agronomist manually measure and create a moisture release curve for each field, Tule built an automated data processing and machine learning pipeline that creates the moisture release curve for each field. The first step in this machine learning process is to select a model - the part of the system that will be trained by data and used to make predictions - for the problem at hand. Data scientists practicing machine learning have access to hundreds of different techniques and model architectures in their toolkit, and determining which technique is best suited for any particular problem involves weighing tradeoffs of different approaches, prototyping possible solutions, and validating the behavior of the model.
For the moisture release curve problem, there were three major criteria used to select the type of model to be used:
- Ability to generalize: the model needs to be sufficiently complex to successfully capture the heterogeneity that is inherent to farming and provide predictive power across the different factors that make each field unique. A model that doesn’t generalize well will only work at a subset of fields.
- Speed of convergence: the model needs to provide useful predictions after a relatively short amount of time (with respect to the growing season). Because plant-water relations within the same field change from one season to the next (due to seasonal variations in climate, weather, canopy size, and other factors), a model that requires too much data to train won’t be useful in practice, as the season would be almost over before the model is ready to use.
- Explainability: different types of models have varying levels of transparency and ability for humans to understand why particular predictions were made, and not all machine learning problems require a high level of explainability. In the case of the moisture release curve problem, after the model is trained and is used to provide predictions, those predictions may disagree with grower’s intuition about what they expect from a field. In these cases, it is important to be able to provide not just a prediction, but also to explain the “why” behind the prediction in order to help growers trust the data enough to act on it.
The team at Tule evaluated a range of model architectures based on these criteria, and ultimately found a combination of techniques that fulfilled all three.
A Machine Learning Solution for Moisture Release Curves
Types of Models Explored
The three criteria listed above helped identify types of models that were likely to provide promising results when applied to the MRC problem. Ultimately, three major techniques were explored in depth:
- A physical model with parameters learned via regression
- A deep learning approach that used labeled data to train a neural network
- A physical model with parameters learned via simulation
Using Tule’s large set of historical data from thousands of fields, the team was able to prototype each solution and testing its performance against real world data from past seasons. This validation against a diverse set of real-world data spanning a wide range of crops, varietals, soil types, geographic locations, weather variations, and other factors provided the feedback loop needed to identify the strongest approach given the three criteria above. Through this prototyping and validation process, the team learned about the strengths and weaknesses of each approach:
- The physical model with parameters learned via regression passed the explainability test, but did not generalize well and took too long to converge.
- The deep learning model provided erratic predictions (which improved with more data, but would then be too slow to converge) and the variations in predictions were not explainable.
- The physical model with parameters learned via simulation proved to be generalizable, quick to converge, and explainable.
After analyzing the results of the prototyping exercise, it was clear that the physical model with parameters learned via simulation was the best approach to move forward with.
How The Model Works
What does it mean to say that Tule’s MRC is a physical model with parameters learned via simulation? In short, it means that there are two components that need to be combined to provide good predictive power:
- A common physical model that captures the real-world processes in the field that impact plant-water relations with sufficient fidelity to provide high quality forecasts across a wide range of conditions. The structure of this physical model is shared across all fields, and was validated against data from thousands of fields to ensure that it can indeed capture the wide range of variation seen in the real world.
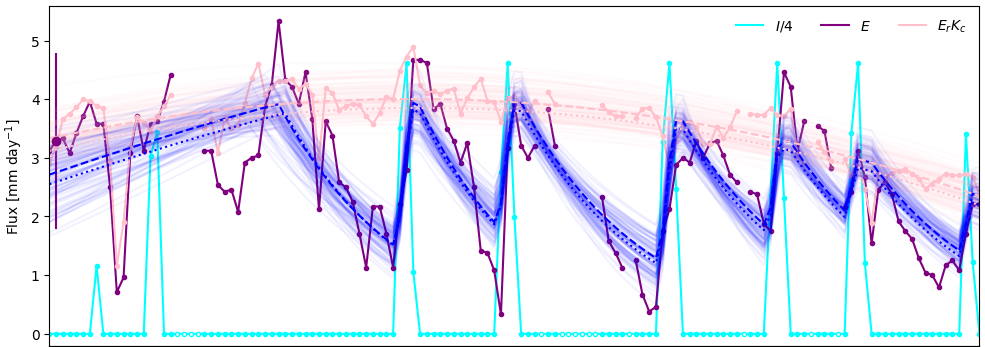
- A set of parameters that are inputs to the physical model. These parameters are the data that provide the model with the information needed to predict the future for an individual field given the latest measurements of the current state of that field. The parameters for each field are site-specific and capture the nuances of the relationship between water and crop stress for each individual field. These parameters are learned for each field using site-specific data from Tule’s sensing systems using a simulation algorithm. The learning process for these site-specific parameters involves simulating millions of possible variations for each field, and choosing values of parameters where the behavior in simulation best matches the measurements observed in the real world.
After the structure above was back-tested using historical data from thousands of fields to verify the validity of the approach, an automated training pipeline was built around this method to enable the model to be used as the basis for a new set of machine-learning powered features in the Tule application that growers interact with. Every day, this pipeline takes the latest information about every field, re-runs the simulations, and updates the parameters for each field to ensure that growers have the best possible predictive information available to them every time they sit down to make an irrigation decision.
How Growers Use It
The feature that Tule introduced based on this machine-learned MRC model is called Water Stress Forecasts. This feature gives growers the ability to quickly and easily inform their irrigation decisions for every field with the power of a site-specific water relations model that is continuously updated throughout the season. It takes the guesswork that growers usually do to make irrigation decisions (collecting information from scouts and other manual measurements and guessing about what the field will do in the future) and replaces that process with a sophisticated machine learning-based system based on automated daily measurements and a site-specific, predictive plant-water relations model created using those measurements.
Here’s how it works from the grower perspective:
- Growers tell Tule what stress range they want their crops to be in during each part of the crop development season based on their yield and quality targets. They can set these goals at the start of the season, but also have the ability to update them throughout the season if needed.
- With no work from the grower, Tule’s daily, automated sensing systems track the current state of the field, including water inputs, outputs, and crop water stress - every day throughout the season.
- Every day, Tule’s machine-learning based data pipeline uses the history of water stress, irrigations, and water use in each field to build a unique, site-specific MRC for every field, which is automatically updated with the most recent data from the field.
- Every morning, the MRC model is used to estimate the field’s crop water stress for every day from the present day until the end of the growing season, identifies when the field next needs water to prevent crop stress from exceeding the thresholds the grower defined, and calculates the quantity of water the grower should apply via their upcoming irrigations to maintain their desired level of crop stress.
- Whenever they need to make an irrigation decision, growers can view this predictive forecast via the Tule dashboard on their computers and smartphones. If they want to experiment with changing their growing strategies, they can adjust their stress thresholds via the Tule application and see immediately what impact those changes will have on the irrigation requirements of their fields.
Stress forecasts answer the age old question of how many days a grower can wait before watering without reducing yield or damaging the plants. The ability to see the future of the field for a range of conditions enables growers to make better irrigation decision across a large number of fields more quickly and with less guesswork. When growers get irrigation right, it ultimately results in better yield and quality for their business.
Lessons Learned
The research and development process behind Tule’s MRC model surfaced a number of lessons learned that are worth keeping in mind for any company interested in bringing machine learning and artificial intelligence into the agriculture industry. This project had several key enablers that made it possible to build and release a validated, trustworthy model for growers in spite of the challenges inherent to modeling a system as complex as a crop field.
Quality of Measurements
Models built using machine learning are only as good as the data used to train them. In the case of the MRC project, capturing high quality evapotranspiration and irrigation data consistently and automatically was key to producing a reliable model. Tule’s unique method of capturing data eliminated several sources of inaccuracy seen in with other measurement methods:
- Traditional, manual measurement techniques often used in agriculture are problematic for machine learning because the signal needed to train reliable models can be masked by noise inherent to measurements taken by human operators (varying levels of expertise, inconsistency in measurement frequency and timing, and subjectivity and bias for observations that rely on human judgement). In contrast, data captured via an automated system provides a dataset without subjectivity or bias across many different fields, which results in a model with better predictive performance.
- Alternative automated estimation methods on the market (dendrometers, for example) don’t provide absolute values of water use or water stress, but instead only provide relative values at best. Data captured using these systems isn’t consistent enough from field to field to capture the broad range conditions observed across a large number of fields, which is required for building a robust model.
- Point-based measurement methods (pressure bombs or soil moisture probes, for example) that capture data from individual plants or small areas of the field may be able to measure stress of a few plants, but there is no way to guarantee that those plants are representative of the field as a whole. In contrast, Tule’s method of measuring evapotranspiration across multiple acres ensures that the data used to train the model will predict the overall plant-water relations of the field (which aligns with the scale that growers work with for irrigation decisions), rather than that of individual plants within the field.
Frequency of Data Collection
When training machine learning models, the ability to reach convergence (the point where the training process identifies a set of optimal parameters with high confidence) is dependent on having enough data for the model to learn how the system being modeled responds to a variety of conditions. In the context of a machine-learned MRC, this means that training a robust model requires data that encompass varying amounts of crop stress, evapotranspiration, and irrigation amounts. At the same time, the fact that fields change every season means that the time required to train the model for each field must be minimized, as the model is only useful in the current season.
For these reasons, measurement methods that are too expensive or labor intensive to use every day (for example, pressure bombs or aerial imagery) wouldn’t work well for building a site-specific model like the MRC. When the measurement method is only feasible to use on a weekly or biweekly cadence, by the time enough data is collected for the model to converge, the season is almost over. Automated methods (like Tule’s evapotranspiration sensors) that capture daily data at a price point that growers can afford are ideal sources of data for machine learning problems. With daily measurements, the time required to capture enough data to reach convergence is reduced by more than 10x compared to the biweekly frequency of other measurement techniques.
Quantity and Diversity of Validation Data
For many machine learning applications (for example, the algorithm that decides which movie you should see next on Netflix), the consequences of releasing a faulty model that provides bad predictions are fairly benign. In these cases, companies are able to release multiple versions of their models as head-to-head tests shown to some of their users and let the actions of those users tell them which model performs best.
Running live experiments on customers is often impossible to do in agriculture - the stakes are too high when it comes to information growers are using to make decisions about their fields. It would be irresponsible for an ag-tech company to release a model for use by growers without first validating that the model provides high quality predictions. This type of pre-release validation is possible, but doing it robustly requires a real-world dataset large enough to encompass the wide variety of conditions growers experience in their fields, including seasonal variations in climate and weather, different crops, varietals, and rootstocks, and a range of soil types and textures.
Datasets that enable this type of robust validation are rare, as public datasets created via academic studies usually cover only a small number (single digits at best) of fields and aren’t sufficiently diverse to capture the heterogeneity inherent to farming. Large, diverse datasets tend to be found only in companies with a scalable model for collecting that data continuously over large numbers of fields. For example, the dataset Tule used for validating the MRC model was collected over multiple years from tens of thousands of acres representing hundreds of different crop, varietal, and rootstock combinations. Tule could not have created the MRC model without using this dataset to prototype solutions, test the performance of different approaches, and verify that the performance of the chosen architecture was sufficiently robust for use by customers. This example illustrates the importance of large, diverse, datasets for companies that are building machine learning and AI-based innovations for the agriculture market.
Looking Forward
As the development process of the MRC project demonstrates, domain expertise in agronomy, deep expertise in machine learning, and access to high quality data are the key ingredients required when using artificial intelligence to solve problems for the agriculture industry. There are only a handful of companies in the ag industry that have demonstrated mastery of this trifecta. Aside from Tule, companies to watch in this space include Blue River (computer vision and robotics for agriculture, Climate Corporation (deep learning for yield analytics), and Granular (valuation predictions for agricultural land).
Although the MRC project was the product of a single company, there are many challenges in agriculture that will require bringing together datasets currently housed in separate silos. To unlock solutions to these problems, ag tech companies will need to partner or create API integrations that enable collaboration. Tule’s recently announced API partnership program is one example of this trend in action. This program is designed to enable Tule’s measured ET data to be used for building machine learning systems for precision agriculture, including forecasting crop yield based on measured field conditions and accurately predicting crop stress from aerial imagery using in-field sensor data as a ground truth for training. Companies interested in partnering with Tule for measured ET and crop stress data can apply here for access.

